官方资料 新手上路:10分钟快速上手 · OpenMV中文入门教程
官方文档:OpenMV 库函数(中文文档)
OpenMV 库函数(官方文档)
相关社群:OpenMV 官网
OpenMV 论坛
GitHub - OpenMV 开源项目库
OpenMV IDE 下载地址
疑难解答 使用 OpenMV IDE 写代码
看到不会的代码 –> 复制到 OpenMV 库函数(中文文档) 搜索栏里粘贴搜索
(PS:中文文档较老旧,有些新固件新函数查询不到,建议跳转至OpenMV 库函数(官方文档) )查找;如果电脑上有OpenMV IDE的,也可以按此路径[C:/Users/你的用户名/AppData/Roaming/OpenMV/openmvide/html/index.html]拖动到浏览器本地查询(内容与英文官方文档一致))
写代码时不知道函数意义的,将光标停留其上,会显示定义
善用快捷键
Ctrl + F 查找
Ctrl + / 批量注释/取消注释
Tab / Shift +Tab 批量缩进/取消缩进
性能优化 一般情况下,除法运算比乘法运算更消耗性能。
https://book.openmv.cc/project/zhui-xiao-qiu-de-xiao-8f665d28-project-pan-tilt-md.html
LAB
Lab:
L-亮度
a:正红负绿;
b:正黄负蓝
感光元件 sensor模块,用于设置感光元件的参数。
举个例子:
1
2
3
4
5
6
7
8
9
10
11
import sensorsensor.reset() sensor.set_pixformat(sensor.RGB565) sensor.set_framesize(sensor.QVGA) sensor.skip_frames() while (True ): img = sensor.snapshot()
使用图像的统计信息 如果我想知道一个区域内的平均颜色或者占面积最大的颜色?
使用统计信息——Statistics!
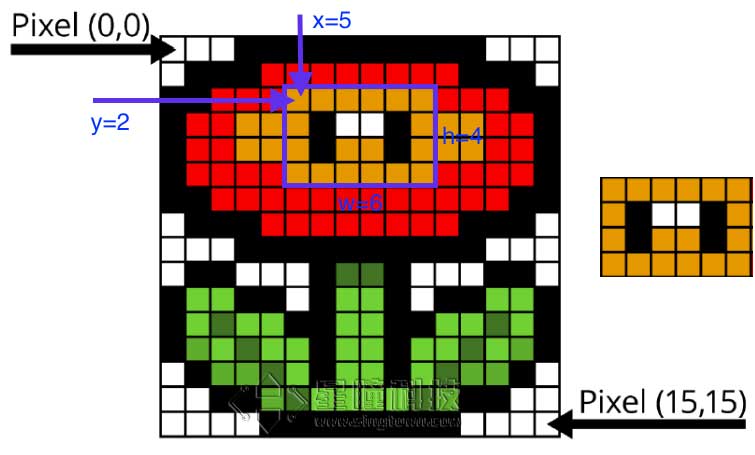
ROI感兴趣的区域
x:ROI区域中左上角的x坐标
y:ROI区域中左上角的y坐标
w:ROI的宽度
h:ROI的高度
OpenMV 自动计算阈值+找色块代码 1 2 3 4 5 6 7 8 9 10 11 12 13 14 15 16 17 18 19 20 21 22 23 24 25 26 27 28 29 import sensor, image, timesensor.reset () sensor.set_pixformat(sensor.RGB565) sensor.set_framesize(sensor.QQVGA) sensor.skip_frames (time = 2000 ) Range = (0 ,0 ,160 ,120 ) for i in range (200 ): img = sensor.snapshot() img.draw_rectangle((75 ,55 ,10 ,10 ),color=(255 ,0 ,0 )) Statistics = img.get_statistics (roi=(75 ,55 ,10 ,10 )) Threshold = [Statistics.l_min(),Statistics.l_max(), Statistics.a_min(),Statistics.a_max(), Statistics.b_min(),Statistics.b_max()] print (Threshold) while (True ): img = sensor.snapshot() for blob in img.find_blobs([Threshold],roi=Range, pixels_threshold=100 , area_threshold=100 , merge=True , margin=10 ): img.draw_rectangle(blob.rect()) img.draw_cross(blob.cx(), blob.cy()) print (blob.cx(), blob.cy())
寻找色块 find_blobs函数 追踪小球是OpenMV用的最多的功能了,在10分钟快速上手 中
1 image.find_blobs(thresholds, roi=Auto, x_stride=2, y_stride=1, invert=False, area_threshold=10, pixels_threshold=10, merge=False, margin=0, threshold_cb=None, merge_cb=None)
这里的参数比较多。
thresholds是颜色的阈值,注意:这个参数是一个列表,可以包含多个颜色。如果你只需要一个颜色,那么在这个列表中只需要有一个颜色值,如果你想要多个颜色阈值,那这个列表就需要多个颜色阈值。注意:在返回的色块对象blob可以调用code方法,来判断是什么颜色的色块。
1 2 3 4 5 6 7 8 red = (xxx,xxx,xxx,xxx,xxx,xxx) blue = (xxx,xxx,xxx,xxx,xxx,xxx) yellow = (xxx,xxx,xxx,xxx,xxx,xxx) img=sensor.snapshot() red_blobs = img.find_blobs([red]) color_blobs = img.find_blobs([red,blue, yellow])
roi是“感兴趣区”。在使用统计信息 中已经介绍过了。
left_roi = [0,0,160,240]
x_stride 就是查找的色块的x方向上最小宽度的像素,默认为2,如果你只想查找宽度10个像素以上的色块,那么就设置这个参数为10:
blobs = img.find_blobs([red],x_stride=10)
y_stride 就是查找的色块的y方向上最小宽度的像素,默认为1,如果你只想查找宽度5个像素以上的色块,那么就设置这个参数为5:
blobs = img.find_blobs([red],y_stride=5)
invert 反转阈值,把阈值以外的颜色作为阈值进行查找
area_threshold 面积阈值,如果色块被框起来的面积小于这个值,会被过滤掉
pixels_threshold 像素个数阈值,如果色块像素数量小于这个值,会被过滤掉
merge 合并,如果设置为True,那么合并所有重叠的blob为一个。
1 2 3 4 5 all_blobs = img.find_blobs([red,blue,yellow],merge=True) red_blobs = img.find_blobs([red],merge=True) blue_blobs = img.find_blobs([blue],merge=True) yellow_blobs = img.find_blobs([yellow],merge=True)
margin 边界,如果设置为1,那么两个blobs如果间距1一个像素点,也会被合并。
阈值 一个颜色阈值的结构是这样的:
1 red = (minL, maxL, minA, maxA, minB, maxB)
元组里面的数值分别是L A B 的最大值和最小值。
如果想在IDE的图像里获取这个阈值,见:10分钟快速上手
在新版的IDE,有更方便的阈值选择工具,见下面。
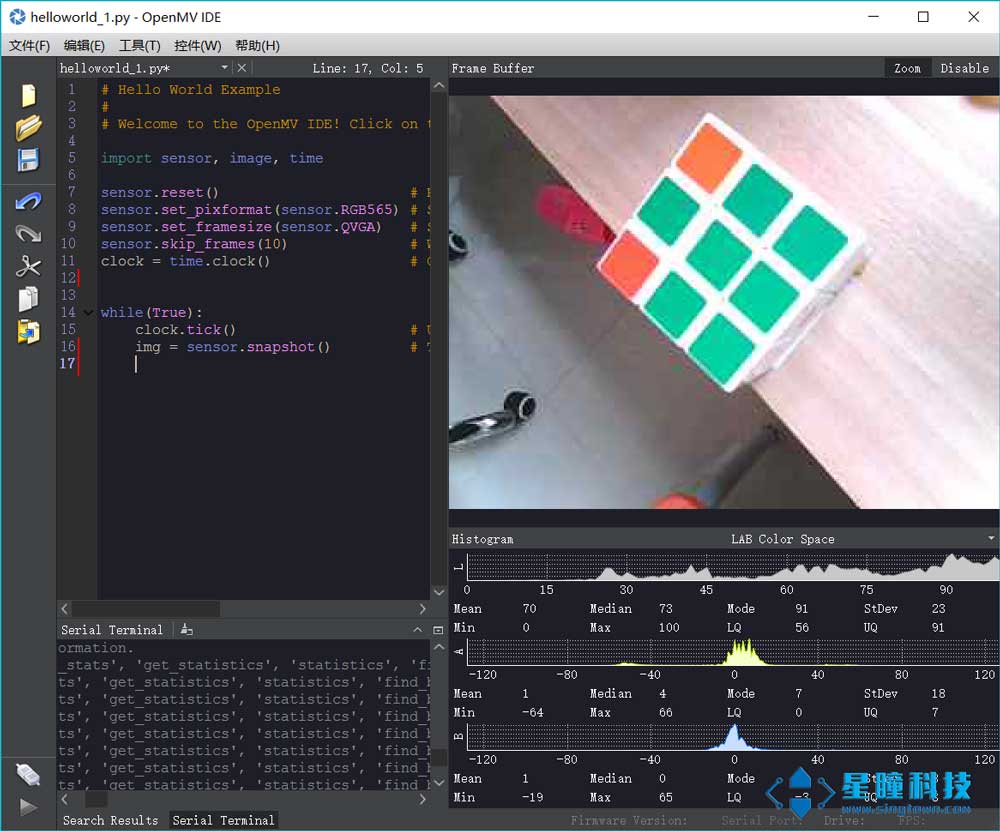
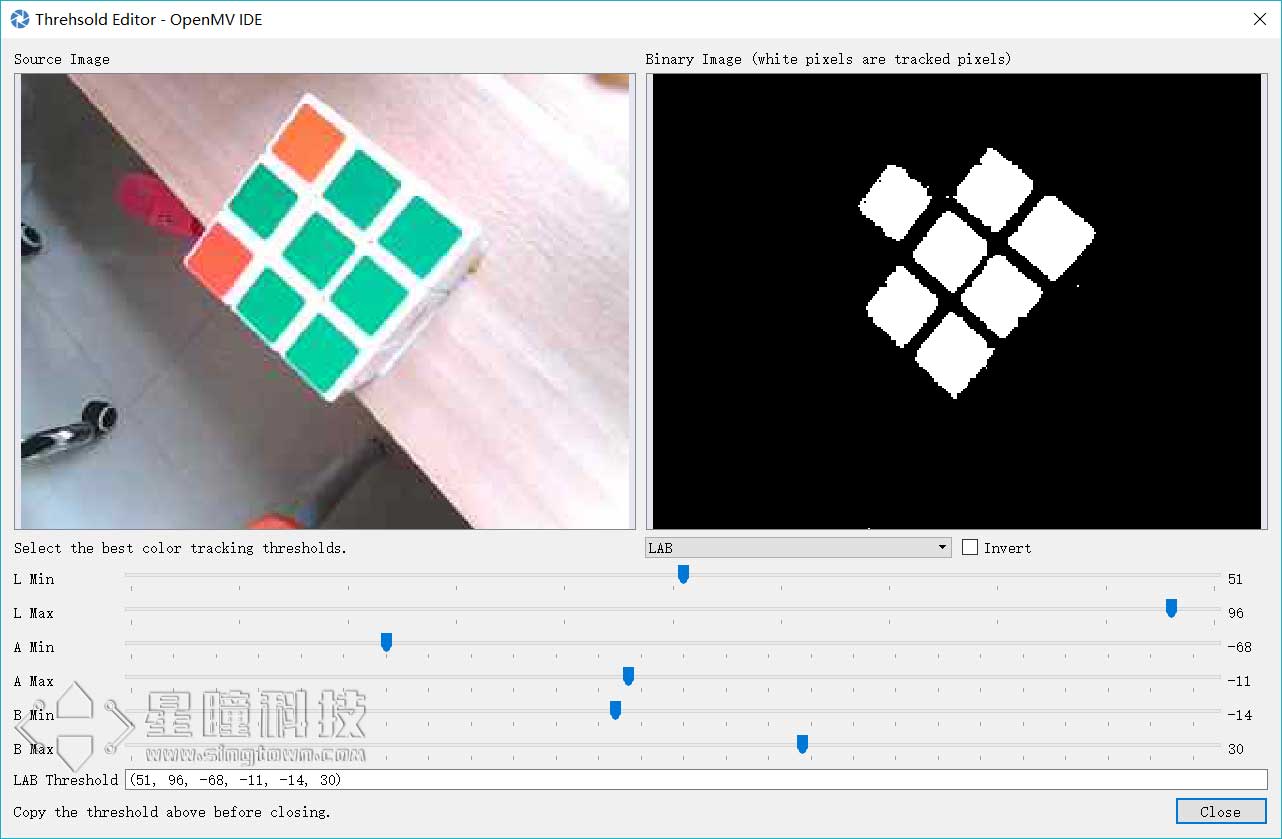
颜色阈值选择工具 OpenMV 的IDE里加入了阈值选择工具,极大的方便了对于颜色阈值的调试。
首先运行hello world.py让IDE里的framebuffer显示图案。
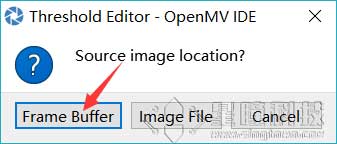
点击 Frame Buffer可以获取IDE中的图像,Image File可以自己选择一个图像文件。
拖动六个滑块,可以实时的看到阈值的结果,我们想要的结果就是,将我们的目标颜色变成白色,其他颜色全变为黑色。
blobs是一个列表 find_blobs对象返回的是多个blob的列表。(注意区分blobs和blob,这只是一个名字,用来区分多个色块,和一个色块)。
1 blobs = img.find_blobs([red])
blobs就是很多色块。
可以用for循环把所有的色块找一遍。
1 2 for blob in blobs: print(blob.cx())
对于for循环的使用,见python背景知识
blob色块对象 blob有多个方法:
blob.rect() 返回这个色块的外框——矩形元组(x, y, w, h),可以直接在image.draw_rectangle中使用。
blob.x() 返回色块的外框的x坐标(int),也可以通过blob[0]来获取。
blob.y() 返回色块的外框的y坐标(int),也可以通过blob[1]来获取。
blob.w() 返回色块的外框的宽度w(int),也可以通过blob[2]来获取。
blob.h() 返回色块的外框的高度h(int),也可以通过blob[3]来获取。
blob.pixels() 返回色块的像素数量(int),也可以通过blob[4]来获取。
blob.cx() 返回色块的外框的中心x坐标(int),也可以通过blob[5]来获取。
blob.cy() 返回色块的外框的中心y坐标(int),也可以通过blob[6]来获取。
blob.rotation() 返回色块的旋转角度(单位为弧度)(float)。如果色块类似一个铅笔,那么这个值为0180°。如果色块是一个圆,那么这个值是无用的。如果色块完全没有对称性,那么你会得到0360°,也可以通过blob[7]来获取。
blob.code() 返回一个16bit数字,每一个bit会对应每一个阈值。举个例子:
blobs = img.find_blobs([red, blue, yellow], merge=True)
如果这个色块是红色,那么它的code就是0001,如果是蓝色,那么它的code就是0010。注意:一个blob可能是合并的,如果是红色和蓝色的blob,那么这个blob就是0011。这个功能可以用于查找颜色代码。也可以通过blob[8]来获取。
blob.count() 如果merge=True,那么就会有多个blob被合并到一个blob,这个函数返回的就是这个的数量。如果merge=False,那么返回值总是1。也可以通过blob[9]来获取。
blob.area() 返回色块的外框的面积。应该等于(w * h)
blob.density() 返回色块的密度。这等于色块的像素数除以外框的区域。如果密度较低,那么说明目标锁定的不是很好。
# OpenMV串口通信 – 传数据包 OpenMV端 1 2 3 data = bytearray ([0xa3 ,0xb3 , obj.classid()+1 , pos[0 ], pos[1 ], 0xc3 ]) usart3.write(data)
STM32端 1 2 3 4 5 6 7 8 9 10 11 12 13 14 15 16 17 18 19 20 21 22 23 24 void USART2_IRQHandler (void ) { static int i=0 ; if (USART_GetITStatus(USART2,USART_IT_RXNE) != RESET) { openmv_data[i++] = USART ReceiveData(USART2); if (openmy_data[0 ]!=0xa3 ) i=0 ; if ((i==2 )&&(openmv_data[1 ]!=0xb3 )) i=0 ; if (i==6 ) { if ( openmv_data[5 ] == 0xc3 ) { openmv_num = openmv_data[2 ]; openmv_x = openmv_date[3 ]; openmv_y = openmv_date[4 ]; } i = 0 ; } } }
多模板匹配 脱机调阈值的实现方法 二值化 - 低于阈值就黑色,高于阈值就白色
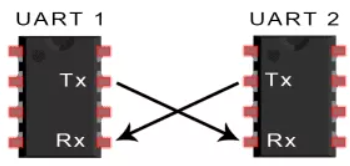
UART UART通信简介 两个UART直接相互通信。发送UART将控制设备(如CPU)的并行数据转换位串行形式,以串行的形式将其发送到接收UART。只需要两条线即可在两个UART之间传输信息:
UART属于异步通信,没有时钟信号。它会在数据包中增加开始和停止位。这些位定义了数据包的开始和结束,因此接收UART知道何时读取这些数据。
原文链接:https://blog.csdn.net/qq_52608074/article/details/122297014
–
1 2 3 4 5 from pyb import UARTuart = UART(3 , 9600 ) uart.write('hello' ) uart.read(5 )
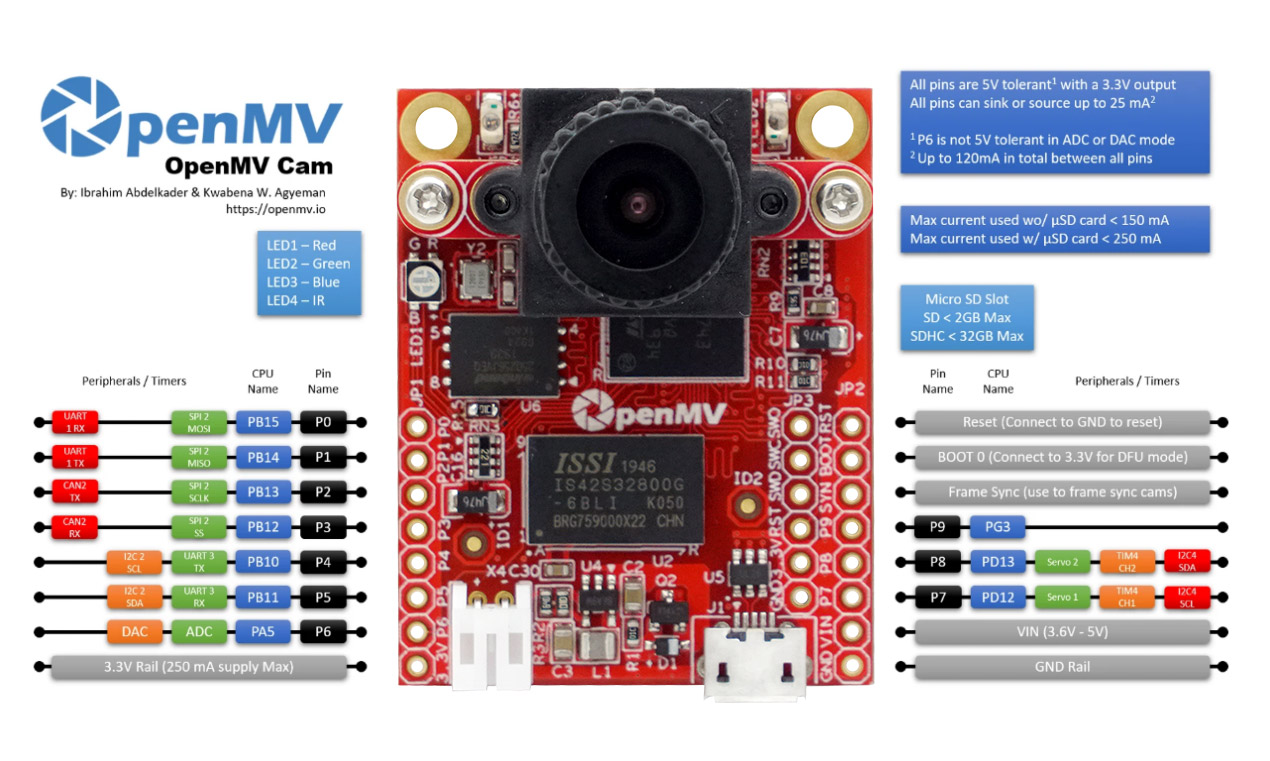
UART 3 RX -> P5 (PB11)
OpenMV3 M7 / OpenMV4 H7/ OpenMV4 H7 Plus上增加:
在 OpenMV RT 上不能用pyb模块,只能使用以下machine模块:
1 2 3 4 5 from machine import UARTuart = UART(1 , 9600 ) uart.write('hello' ) uart.read(5 )
OpenMV RT1062只有串口1,对应 P4 P5 引脚。 UART 1 RX -> P5 (PB11)
OpenMV配置图及引脚图
Tables
OpenMV2 M4
OpenMV3 M7
OpenMV4 H7
OpenMV4 H7 Plus
OpenMV RT1062
Pin
9
10
10
10
14
ADC
1
1
1
1
1
DAC
1
1
1
1
0
SPI
1
1
1
1
1
I2C
1
2
2
2
1
UART
1
2
2
2
1
Servo
2
3
3
2
4
CAN bus
0
1
1
1
1
电源按键
0
0
0
0
1
自定义按键
0
0
0
0
1
引脚耐受
5V
5V
5V
5V
3.3V
引脚电平
3.3V
3.3V
3.3V
3.3V
3.3V
IC
STM32F427
STM32F765
STM32H743
STM32H743
IMXRT1062
RAM
256KB
512KB
1MB
32MB + 1MB
32MB + 1MB
Flash
1MB
2MB
2MB
32MB + 2MB
16MB
频率
180MHz
216MHZ
480MHZ
480MHZ
600MHZ
标配感光元件
OV7725(30W像素)
OV7725(30W像素)
OV7725(30W像素)
OV5640(500W像素)
OV5640(500W像素)
tf.classify(path, img[, roi[, min_scale=1.0[, scale_mul=0.5[, x_overlap=0[, y_overlap=0]]]]])
在 img 上运行TensorFlow Lite图像分类模型,并返回一个 tf_classification 对象列表。 这个方法对图像使用可控滑动方式,执行多次模型(默认算法在整个图像帧上只执行网络一次)。
path 是OpenMV Cam的磁盘上的 .tflite 模型的路径。 为了节省内存,只通过这一个函数,模型被加载到内存中,执行并释放所有内存。 传递 “person_detection” 可以从你的OpenMV Cam的内部FLASH加载内置的人检测模型。
roi 是感兴趣区域矩形元组(x, y, w, h)。如果没有指定时,它等于图像的整个大小。 只有在 roi 内的像素才被操作。
min_scale 控制网络的缩放尺度。在默认值网络不缩放。 当值为0.5时,会允许检测大小为图像roi的50%的目标。
scale_mul 控制有多少种不同的缩放尺度可以检测出来。 滑动窗口方法的工作原理是将默认的尺度1乘以 scale_mul 同时结果大于 min_scale 。 scale_mul 的默认值是0.5,测试出每次变化可以减少50%的大小。但是,0.95只会减少5%的尺寸。
x_overlap 控制与下一个滑动窗口的区域检测器重叠的百分比。 值为0意味着没有重叠,0.95意味着95%的重叠。
y_overlap 控制与下一个滑动窗口的区域检测器重叠的百分比。 值为0意味着没有重叠,0.95意味着95%的重叠。
image.get_statistics ([thresholds , invert=False [ , roi [ , bins [ , l_bins [ , a_bins [ , b_bins [ , difference ]] ] ] )
计算 roi 中每个颜色通道的平均值、中值、众值、标准偏差、最小值、最大值、下四分值和上四分值,并返回一个数据对象。 请参见 statistics 对象以获取更多信息。您也可以使用 image.get_stats 或 image.statistics 来调用这一方法。 如果传递 thresholds 列表,则直方图信息将仅从阈值列表中的像素计算得出。
thresholds 必须是元组列表。 [(lo, hi), (lo, hi), ..., (lo, hi)] 定义你想追踪的颜色范围。 对于灰度图像,每个元组需要包含两个值 - 最小灰度值和最大灰度值。 仅考虑落在这些阈值之间的像素区域。 对于RGB565图像,每个元组需要有六个值(l_lo,l_hi,a_lo,a_hi,b_lo,b_hi) - 分别是LAB L,A和B通道的最小值和最大值。 为方便使用,此功能将自动修复交换的最小值和最大值。 此外,如果元组大于六个值,则忽略其余值。相反,如果元组太短,则假定其余阈值处于最大范围。
备注
获取所跟踪对象的阈值,只需在IDE帧缓冲区中选择(单击并拖动)跟踪对象。 直方图会相应地更新到所在区域。然后只需写下颜色分布在每个直方图通道中起始与下降位置。 这些将是 thresholds 的低值和高值。 由于上下四分位数据相差微小,故手动确定阈值为佳。
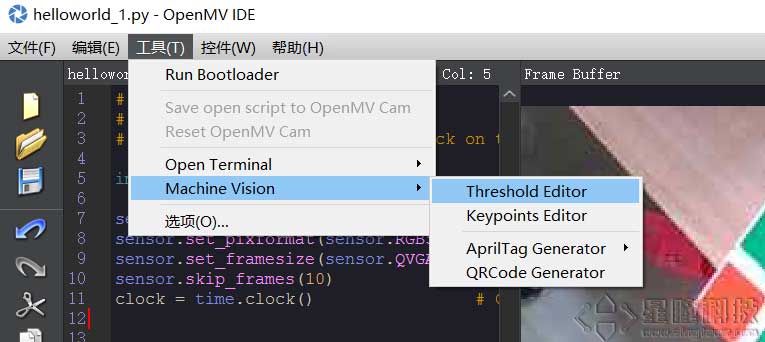
您还可以通过进入OpenMV IDE中的 工具 ->机器视觉 ->阈值编辑器 并从GUI窗口中拖动滑块来确定颜色阈值。
文件系统 在10分钟上手教程 中已经简单介绍过OpenMV上的文件系统。这里是一些细节。
MicroPyhon的文件系统是FatFS。
根目录 路径都是以根目录为起点。
当插入sd卡后,根目录就是SD卡;不插入sd卡,根目录就是内置的Flash。
如果需要,你可以在SD卡上,新建一个空文件:/flash/SKIPSD,这会避免挂载SD卡,当然,你可以使用os.mount来手动挂载SD卡。
绝对路径与相对路径 绝对路径是以根目录为起点的,相对路径是以当前目录为起点的。
1 2 image.save("/example.jpg") Copy
中的”/example.jpg”就是绝对路径。会存放在根目录/下。
1 2 3 image.save("./pic/example.jpg") image.save("pic/example.jpg") Copy
这就是相对路径,表示当前路径下的pic文件夹下的example.jpg文件。
MicroPython的文件读写 http://www.cnblogs.com/feeland/p/4477535.html
MicroPython的OS模块 在代码中,可以使用os库,来进行新建目录,新建文件之类的操作。
os.listdir([dir])
os.chdir(path)
os.getcwd()
os.mkdir(path)
os.remove(path)
os.rmdir(path)
os.rename(old_path, new_path)
os.stat(path)
OpenMV的默认文件
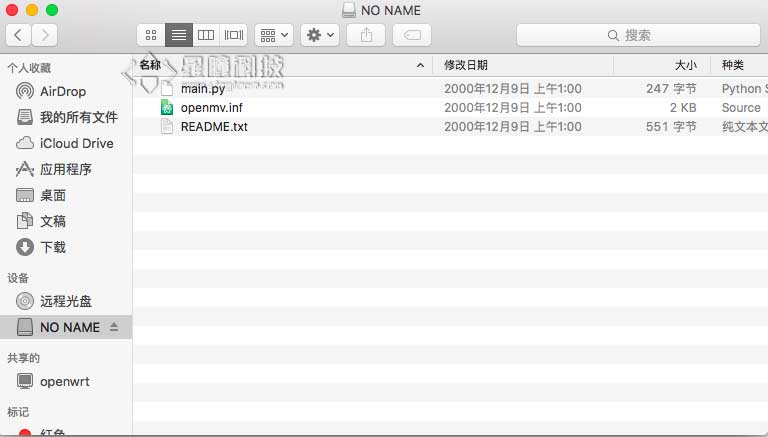
默认情况下,OpenMV的磁盘有三个文件。
main.py
openmv.inf
README.txt
你需要了解的相关基础概念:
LAB 阈值 ROI UART IO
你需要实现的相关功能:
find_blogs 巡线
QQ截图对比前后差异
自适应阈值探究:
理论最深LAB:(0, 0, -128, -128, -128, -128)
理论最亮LAB:(100, 100, 127, 127, 127, 127)
所以 理论默认LAB:(50, 50, 0, 0, 0, 0)
实际最深LAB:(1, 53, -1, 80, 0, 66)
已实现的方案: 1.巡线、判断十字路口: 1 2 3 4 5 6 7 8 9 10 11 12 13 14 15 16 17 18 19 20 21 22 23 24 25 26 27 28 29 30 31 32 33 34 35 36 37 38 39 40 41 42 43 44 45 46 47 48 49 50 51 52 53 54 55 56 57 import sensor, image, time, pybimport displayfrom pyb import UART, LEDLED(1 ).on() LED(2 ).on() LED(3 ).on() uart = pyb.UART(3 , 9600 ) uart.init(9600 , bits=8 , parity=None , stop=1 ) sensor.reset() sensor.set_pixformat(sensor.RGB565) sensor.set_framesize(sensor.QQVGA2) sensor.set_auto_gain(False ) sensor.set_auto_whitebal(False ) lcd = display.SPIDisplay() sensor.skip_frames (time = 1000 ) clock = time.clock() def find_max (blobs ): max_size=0 for blob in blobs: if blob[2 ]*blob[3 ] > max_size: max_blob=blob max_size = blob[2 ]*blob[3 ] return max_blob theta_err = 90 rotate_angle = 90 crossroad = 0 while (True ): clock.tick() img = sensor.snapshot().binary([(4 , 70 , 18 , 127 , -125 , 127 )]) blobs = img.find_blobs([(20 , 255 )], x_stride=1 , y_stride=1 , pixels_threshold=180 , area_threshold=180 , merge=True ) if blobs: max_blob = find_max(blobs) rotate_angle = 180 * (max_blob.cx() / img.width()) if max_blob.w()<img.width()*0.7 : crossroad = 0 else : crossroad = 1 img.draw_rectangle(max_blob.rect()) img.draw_cross(max_blob.cx(), max_blob.cy(),color=(255 ,0 ,0 )) line = img.get_regression([(20 , 255 )], pixels_threshold=120 , area_threshold=120 , robust = True ) if line: if line.theta()>90 : theta_err = line.theta()-90 else : theta_err = line.theta()+90 img.draw_line(line.line(), color = 127 ) chimera = theta_err*0.7 + rotate_angle*0.3 img.draw_string(10 , 10 , str (int (chimera)), color=(0 ,185 ,255 ), scale=2 , x_spacing=-5 ) data=bytearray ([0xa3 ,0xb3 ,int (chimera),int (crossroad),0xc3 ]) uart.write(data) print (" " ) print ("当前帧数:" , clock.fps(), "fps" ) print ("是否检测到十字路口:" , crossroad) print ("推荐转向" , chimera) lcd.write(img)
2.匿名凌霄无人机识别黑色矩形区域降落: 1 2 3 4 5 6 7 8 9 10 11 12 13 14 15 16 17 18 19 20 21 22 23 24 25 26 27 28 29 30 31 32 33 34 35 36 37 38 39 40 41 42 43 44 45 46 47 48 49 50 51 52 53 54 55 56 57 58 59 60 61 62 63 64 65 66 67 68 69 70 71 72 73 74 import sensor, image, time, pyb, displayfrom pyb import UARTimport jsonimport ustructsensor.reset() sensor.set_pixformat(sensor.RGB565) sensor.set_framesize(sensor.QVGA) sensor.skip_frames(time=2000 ) sensor.set_auto_gain(False ) sensor.set_auto_whitebal(False ) lcd = display.SPIDisplay() clock = time.clock() uart3 = UART(3 , 500000 , timeout_char=1000 ) blue_threshold = (0 ,30 ,-128 ,10 ,-128 ,127 ) yellow_threshold = (58 ,100 ,-128 ,127 ,-128 ,127 ) k = 950 moshi=0 def find_max (blobs ): max_size=0 for blob in blobs: if blob[2 ]*blob[3 ] > max_size: max_blob=blob max_size = blob[2 ]*blob[3 ] return max_blob while True : clock.tick() img = sensor.snapshot() blobs_blue = img.find_blobs([blue_threshold], roi = (0 ,0 ,img.width(),img.height())) if blobs_blue: b = find_max(blobs_blue) if b.density()>0.7 and b.w()>img.width()*0.3 : img.draw_cross(b[5 ], b[6 ]) img.draw_cross(int (img.width()*0.5 ), int (img.height()*0.5 ), size=5 , color=(0 ,255 ,0 )) img.draw_line((int (img.width()*0.5 ), int (img.height()*0.5 ),b[5 ], b[6 ]), color=(255 ,0 ,255 )) a_x=b.cx()-int (img.width()*0.5 ) a_y=b.cy()-int (img.height()*0.5 ) img.draw_rectangle(b.rect(), color = (0 , 0 , 255 )) FH = bytearray ([0xAA ,0xFF ,0xCC ,0x00 ,moshi,a_x,a_y,0x00 ,0x00 ]) lens = len (FH) FH[3 ] = lens-6 ; i = 0 sum = 0 sum1 = 0 while i<(lens-2 ): sum = sum + FH[i] sum1 = sum1 + sum i = i+1 FH[lens-2 ] = sum ; FH[lens-1 ] = sum1; uart3.write(FH) print (FH) print ("x偏移:" ,a_x,"y偏移:" ,a_y,"\n" ) img.draw_string(10 , 10 , str (a_x) + "," + str (a_y), color=(255 ,0 ,70 ), scale=2 , x_spacing=-5 , mono_space=True ) else : print ("未检测" ) else : print ("未检测" ) img_copy = img.copy(x_scale=128 /img.width(),y_scale=160 /img.height()) lcd.write(img_copy)
3.识别矩形、返回矩形四角坐标: 1 2 3 4 5 6 7 8 9 10 11 12 13 14 15 16 17 18 19 20 21 22 23 24 25 26 27 28 29 30 31 32 33 34 35 36 37 38 39 import sensor, image, time, pybimport displayfrom pyb import UARTuart = pyb.UART(3 , 9600 ) uart.init(9600 , bits=8 , parity=None , stop=1 ) lcd = display.SPIDisplay() sensor.reset() sensor.set_pixformat(sensor.RGB565) sensor.set_framesize(sensor.QQVGA2) sensor.set_auto_gain(False ) sensor.set_auto_whitebal(False ) sensor.skip_frames(time = 500 ) clock = time.clock() while (True ): clock.tick() img = sensor.snapshot() for r in img.find_rects(threshold = 10000 ): if r.w() > 15 and r.h() > 15 : img.draw_rectangle(r.rect(), color = (255 , 0 , 0 ), scale = 4 ) corner = r.corners() img.draw_circle(corner[0 ][0 ], corner[0 ][1 ], 3 , color = (135 , 255 , 0 ), thickness = 2 , fill = False ) img.draw_circle(corner[1 ][0 ], corner[1 ][1 ], 3 , color = (0 , 70 , 255 ), thickness = 1 , fill = False ) img.draw_circle(corner[2 ][0 ], corner[2 ][1 ], 3 , color = (0 , 70 , 255 ), thickness = 1 , fill = False ) img.draw_circle(corner[3 ][0 ], corner[3 ][1 ], 3 , color = (0 , 70 , 255 ), thickness = 1 , fill = False ) corner1_str = f"({corner[0 ][0 ]} ,{corner[0 ][1 ]} )" corner2_str = f"({corner[1 ][0 ]} ,{corner[1 ][1 ]} )" corner3_str = f"({corner[2 ][0 ]} ,{corner[2 ][1 ]} )" corner4_str = f"({corner[3 ][0 ]} ,{corner[3 ][1 ]} )" print ("矩形关键点坐标:" ) print ("corner1 = " + corner1_str + "\n" + "corner2 =" + corner2_str + "\n" + "corner3 =" + corner3_str + "\n" + "corner4 =" + corner4_str ) dataxy=bytearray ([0xa1 ,0xb1 ,corner[0 ][0 ],corner[1 ][0 ],corner[2 ][0 ],corner[3 ][0 ],corner[0 ][1 ],corner[1 ][1 ],corner[2 ][1 ],corner[3 ][1 ],0xc1 ]) uart.write(dataxy) img.draw_string(10 , 10 , corner1_str, color=(255 ,0 ,70 ), scale=2 , x_spacing=-5 , mono_space=True ) img.draw_string(10 , 10 , "\n" + corner3_str, color=(255 ,0 ,70 ), scale=2 , x_spacing=-5 , mono_space=True ) lcd.write(img)
4.延时拍照片并存储 1 2 3 4 5 6 7 8 9 10 11 12 13 14 15 16 17 18 19 20 import sensorimport timeimport display sensor.reset() sensor.set_pixformat(sensor.RGB565) sensor.set_framesize(sensor.QVGA) lcd = display.SPIDisplay() sensor.skip_frames(time=2000 ) img = sensor.snapshot() img.save("example.jpg" ) img_copy = img.copy(x_scale=128 /img.width(),y_scale=160 /img.height()) while (True ): lcd.write(img_copy)
5.计算指定区域最暗/最亮阈值: 1 2 3 4 5 6 7 8 9 10 11 12 13 14 15 16 17 18 19 20 21 22 23 24 25 26 27 28 29 30 31 32 33 34 35 36 37 38 39 40 41 42 43 44 45 46 47 48 49 50 51 52 import sensor, image, time, pybimport display from pyb import UARTuart = pyb.UART(3 , 9600 ) uart.init(9600 , bits=8 , parity=None , stop=1 ) lcd = display.SPIDisplay() sensor.reset() sensor.set_pixformat(sensor.RGB565) sensor.set_framesize(sensor.QVGA) sensor.set_auto_gain(False ) sensor.set_auto_whitebal(False ) sensor.skip_frames(time = 500 ) clock = time.clock() for i in range (200 ): img = sensor.snapshot() img.draw_rectangle((0 ,0 ,img.width(),img.height()),color=(255 ,0 ,0 )) statistics = img.get_statistics (roi=(0 ,0 ,img.width(),img.height())) color_L_min = statistics.l_min() color_L_max = statistics.l_max() color_A_min = statistics.a_min() color_A_max = statistics.a_max() color_B_min = statistics.b_min() color_B_max = statistics.b_max() relative_darkest_threshold = (color_L_min, color_L_min+1 , color_A_min, color_A_min+1 , color_B_min, color_B_min+1 ) relative_brightest_threshold = (color_L_max-1 , color_L_max, color_A_max-1 , color_A_max, color_B_max-1 , color_B_max) print (relative_darkest_threshold) print (relative_brightest_threshold) print ("\n" ) while True : clock.tick() img = sensor.snapshot() print (relative_darkest_threshold) print (relative_brightest_threshold) print ("\n" )
整理已经弄清楚的知识点: (不明白的去官方函数库查询) 1.初始化: 摄像头(感光元件)初始化: 1 2 3 4 5 6 7 8 9 10 11 import sensorsensor.reset() sensor.set_pixformat(sensor.RGB565) sensor.set_framesize(sensor.QQVGA2) sensor.set_auto_gain(False ) sensor.set_auto_whitebal(False ) sensor.skip_frames (time = 1000 )
图像处理(机器视觉)初始化: 时钟(跟踪运行时间)初始化: 1 2 3 import timeclock = time.clock()
屏幕显示驱动初始化: 1 2 3 4 import display lcd = display.SPIDisplay() lcd.write(img)
串口通信(UART)初始化: 1 2 3 4 5 6 7 8 import pybfrom pyb import UART uart = UART(3 , 9600 , timeout_char=1000 ) uart.init(9600 , bits=8 , parity=None , stop=1 , timeout_char=1000 )
LED(补光灯)初始化: 1 2 3 4 5 from pyb import LED LED(1 ).on() LED(2 ).on() LED(3 ).on()
引脚高低电平初始化: 1 2 3 4 5 from pyb import Pin p0 = Pin('P0' , Pin.OUT) p0.value(1 )
2.全局变量定义、自定义函数定义: 最大色块更新函数: 1 2 3 4 5 6 7 8 def find_max (blobs ): max_size=0 for blob in blobs: if blob[2 ]*blob[3 ] > max_size: max_blob=blob max_size = blob[2 ]*blob[3 ] return max_blob
ROI(感兴趣区域): Thresholds(阈值列表): 1 2 3 4 5 thresholds = [(4 , 70 , 18 , 127 , -125 , 127 ), (0 , 35 , 20 , 75 , -25 , 45 ), (13 , 70 , 3 , 55 , 4 , 40 ), (30 , 100 , -64 , -8 , -32 , 32 ), (0 , 30 , 0 , 64 , -128 , 0 )]
3.启动任务进程: 标准进程框架: 1 2 3 4 5 6 while (True ): clock.tick() img = sensor.snapshot() x'x' x'x' x'x' x'x' x (其他任务、算法) lcd.write(img)
算法: 1.最大色块算法(包含十字路口检测): 1 2 3 4 5 6 7 8 9 10 11 12 13 14 15 16 17 18 19 20 blobs = img.find_blobs([(20 , 255 )], x_stride=1 , y_stride=1 , pixels_threshold=180 , area_threshold=180 , merge=True ) if blobs: max_blob = find_max(blobs) rotate_angle = 180 * (max_blob.cx() / img.width()) if max_blob.w()<img.width()*0.7 : crossroad = 0 else : crossroad = 1 img.draw_rectangle(max_blob.rect()) img.draw_cross(max_blob.cx(), max_blob.cy(),color=(255 ,0 ,0 ))
2.直线算法: 1 2 3 4 5 6 7 8 9 line = img.get_regression([(20 , 255 )], pixels_threshold=120 , area_threshold=120 , robust = True ) if line: if line.theta()>90 : theta_err = line.theta()-90 else : theta_err = line.theta()+90 img.draw_line(line.line(), color = 127 )
3.最大色块+直线融合算法: 1 2 3 4 5 6 7 8 9 10 11 12 13 14 15 16 17 18 19 20 21 22 23 24 25 26 27 28 29 30 31 32 33 34 35 36 37 38 39 40 41 42 43 44 45 46 47 48 49 50 51 52 53 54 blobs = img.find_blobs([(20 , 255 )], x_stride=1 , y_stride=1 , pixels_threshold=180 , area_threshold=180 , merge=True ) if blobs: max_blob = find_max(blobs) rotate_angle = 180 * (max_blob.cx() / img.width()) if max_blob.w()<img.width()*0.7 : crossroad = 0 else : crossroad = 1 img.draw_rectangle(max_blob.rect()) img.draw_cross(max_blob.cx(), max_blob.cy(),color=(255 ,0 ,0 )) line = img.get_regression([(20 , 255 )], pixels_threshold=120 , area_threshold=120 , robust = True ) if line: if line.theta()>90 : theta_err = line.theta()-90 else : theta_err = line.theta()+90 img.draw_line(line.line(), color = 127 ) chimera = theta_err*0.7 + rotate_angle*0.3 img.draw_string(10 , 10 , str (int (chimera)), color=(0 ,185 ,255 ), scale=2 , x_spacing=-5 ) data=bytearray ([0xa3 ,0xb3 ,int (chimera),int (crossroad),0xc3 ]) uart.write(data) print (" " ) print ("当前帧数:" , clock.fps(), "fps" ) print ("是否检测到十字路口:" , crossroad) print ("推荐转向" , chimera)
4.矩形检测+返回矩形四角坐标算法: 1 2 3 4 5 6 7 8 9 10 11 12 13 14 15 16 17 18 19 20 21 22 23 24 25 26 27 28 29 30 31 32 33 34 35 36 37 38 39 40 41 42 43 44 45 for r in img.find_rects(threshold = 10000 ): if r.w() > 15 and r.h() > 15 : img.draw_rectangle(r.rect(), color = (255 , 0 , 0 ), scale = 4 ) corner = r.corners() img.draw_circle(corner[0 ][0 ], corner[0 ][1 ], 3 , color = (135 , 255 , 0 ), thickness = 2 , fill = False ) img.draw_circle(corner[1 ][0 ], corner[1 ][1 ], 3 , color = (0 , 70 , 255 ), thickness = 1 , fill = False ) img.draw_circle(corner[2 ][0 ], corner[2 ][1 ], 3 , color = (0 , 70 , 255 ), thickness = 1 , fill = False ) img.draw_circle(corner[3 ][0 ], corner[3 ][1 ], 3 , color = (0 , 70 , 255 ), thickness = 1 , fill = False ) corner1_str = f"({corner[0 ][0 ]} ,{corner[0 ][1 ]} )" corner2_str = f"({corner[1 ][0 ]} ,{corner[1 ][1 ]} )" corner3_str = f"({corner[2 ][0 ]} ,{corner[2 ][1 ]} )" corner4_str = f"({corner[3 ][0 ]} ,{corner[3 ][1 ]} )" print ("矩形关键点坐标:" ) print ("corner1 = " + corner1_str + "\n" + "corner2 =" + corner2_str + "\n" + "corner3 =" + corner3_str + "\n" + "corner4 =" + corner4_str ) dataxy=bytearray ([0xa1 ,0xb1 ,corner[0 ][0 ],corner[1 ][0 ],corner[2 ][0 ],corner[3 ][0 ],corner[0 ][1 ],corner[1 ][1 ],corner[2 ][1 ],corner[3 ][1 ],0xc1 ]) uart.write(dataxy) img.draw_string(10 , 10 , corner1_str, color=(255 ,0 ,70 ), scale=2 , x_spacing=-5 , mono_space=True ) img.draw_string(10 , 10 , "\n" + corner3_str, color=(255 ,0 ,70 ), scale=2 , x_spacing=-5 , mono_space=True )
俯视检测追踪特定颜色矩形算法: 1 2 3 4 5 6 7 8 9 10 11 12 13 14 15 16 17 18 19 20 21 22 23 24 25 26 27 28 29 30 31 32 33 34 35 36 37 blobs_blue = img.find_blobs([blue_threshold], roi = (0 ,0 ,img.width(),img.height())) if blobs_blue: b = find_max(blobs_blue) if b.density()>0.7 and b.w()>img.width()*0.3 : img.draw_cross(b[5 ], b[6 ]) img.draw_cross(int (img.width()*0.5 ), int (img.height()*0.5 ), size=5 , color=(0 ,255 ,0 )) img.draw_line((int (img.width()*0.5 ), int (img.height()*0.5 ),b[5 ], b[6 ]), color=(255 ,0 ,255 )) a_x=b.cx()-int (img.width()*0.5 ) a_y=b.cy()-int (img.height()*0.5 ) img.draw_rectangle(b.rect(), color = (0 , 0 , 255 )) FH = bytearray ([0xAA ,0xFF ,0xCC ,0x00 ,moshi,a_x,a_y,0x00 ,0x00 ]) lens = len (FH) FH[3 ] = lens-6 ; i = 0 sum = 0 sum1 = 0 while i<(lens-2 ): sum = sum + FH[i] sum1 = sum1 + sum i = i+1 FH[lens-2 ] = sum ; FH[lens-1 ] = sum1; uart3.write(FH) print (FH) print ("x偏移:" ,a_x,"y偏移:" ,a_y,"\n" ) img.draw_string(10 , 10 , str (a_x) + "," + str (a_y), color=(255 ,0 ,70 ), scale=2 , x_spacing=-5 , mono_space=True ) else : print ("未检测" ) else : print ("未检测" )
指定区域阈值检测算法: 1 2 3 4 5 6 7 8 9 10 11 12 13 14 15 16 for i in range (200 ): img = sensor.snapshot() img.draw_rectangle((0 ,0 ,img.width(),img.height()),color=(255 ,0 ,0 )) statistics = img.get_statistics (roi=(0 ,0 ,img.width(),img.height())) color_L_min = statistics.l_min() color_L_max = statistics.l_max() color_A_min = statistics.a_min() color_A_max = statistics.a_max() color_B_min = statistics.b_min() color_B_max = statistics.b_max() relative_darkest_threshold = (color_L_min, color_L_min+1 , color_A_min, color_A_min+1 , color_B_min, color_B_min+1 ) relative_brightest_threshold = (color_L_max-1 , color_L_max, color_A_max-1 , color_A_max, color_B_max-1 , color_B_max)
屏幕图像缩放显示: 1 img_copy = img.copy(x_scale=128 /img.width(),y_scale=160 /img.height())
屏幕显示参数: 1 2 3 4 5 img.draw_string(10 , 10 , str (int (chimera)), color=(0 ,185 ,255 ), scale=2 , x_spacing=-5 ) img.draw_string(10 , 10 , corner1_str, color=(255 ,0 ,70 ), scale=2 , x_spacing=-5 , mono_space=True ) mg.draw_string(10 , 10 , "\n" + corner3_str, color=(255 ,0 ,70 ), scale=2 , x_spacing=-5 , mono_space=True )
串口数据定义并发送: 1 2 3 4 5 data=bytearray ([0xa3 ,0xb3 ,int (chimera),int (crossroad),0xc3 ]) uart.write(data)
串行终端发送: 1 2 3 4 5 6 7 8 9 10 11 12 print (" " ) print ("当前帧数:" , clock.fps(), "fps" ) print ("是否检测到十字路口:" , crossroad) print ("推荐转向" , chimera)
AprilTag: 一句话解释作用:AprilTag 是一种二维条形码,可以根据它得到
标签的id(编号)、三个坐标量和三个旋转量(以相机位置为原点)
推荐TAG36H11家族(587标签)
1 2 3 4 5 6 7 8 9 10 11 12 13 14 15 16 17 18 19 20 21 22 23 24 25 26 27 28 29 30 31 32 33 34 35 36 37 38 39 40 41 42 43 44 45 import sensor, image, time, mathsensor.reset() sensor.set_pixformat(sensor.RGB565) sensor.set_framesize(sensor.QQVGA) sensor.skip_frames(30 ) sensor.set_auto_gain(False ) sensor.set_auto_whitebal(False ) clock = time.clock() f_x = (2.8 / 3.984 ) * 160 f_y = (2.8 / 2.952 ) * 120 c_x = 160 * 0.5 c_y = 120 * 0.5 def degrees (radians ): return (180 * radians) / math.pi while (True ): clock.tick() img = sensor.snapshot() for tag in img.find_apriltags(fx=f_x, fy=f_y, cx=c_x, cy=c_y): img.draw_rectangle(tag.rect(), color = (255 , 0 , 0 )) img.draw_cross(tag.cx(), tag.cy(), color = (0 , 255 , 0 )) print_args = (tag.x_translation(), tag.y_translation(), tag.z_translation(), \ degrees(tag.x_rotation()), degrees(tag.y_rotation()), degrees(tag.z_rotation())) print ("Tx: %f, Ty %f, Tz %f, Rx %f, Ry %f, Rz %f" % print_args) print (clock.fps())
Tx: 左右移动 Ty:上下移动 Tz:距离
Rx:上下旋转 Ry:左右旋转 Rz:自转